You are using an out of date browser. It may not display this or other websites correctly.
You should upgrade or use an alternative browser.
You should upgrade or use an alternative browser.
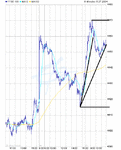
FTSE is finding it hard to breakout.
The previous high 4472 has held the early morning advance.
The good news so far is that the setback since appears to have held at the 38% Fib
of the move from 4415-4470.
see chart.
Maybe upcoming Bank holiday and US holiday is putting people off.
Anyway off for another boy's lunch (my birthday) so will not be active/alert.
Attachments
I know it is Friday, and it is ahead of a long weekend in both the UK and USA.
However, US markets acting well, which eventually should impact FTSE.
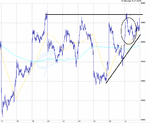
re chart:
Yesterday saw FTSE fail to overcome the high (4472) recorded on the 19/05/04.
Then saw a clear ABC correction, before the FTSE resumed it upwards path.
Obviously, first hurdle is overcoming the 4472 barrier.
Then up to 4500?
Attachments
stevecartwright
Member
- Messages
- 51
- Likes
- 1
Is everyone on holiday today
Just been having a quiet lurk - reverted to type.
Noticed ftse closed the opening gap 17 points. You may gather I'm into gaps at the moment.
Lunatic markets operational - oil price up,markets fall; oil price down, markets rise ( so far so good) and finally oil price still down but markets fall because oil companies fall on fall of oil price!
ftse has seen the ceiling and did not like it, perhaps if the oil price rises it will go up!
But must remember the mully maxim, all together now - Trade what you see Not what you think.
Regards
bracke
stevecartwright
Member
- Messages
- 51
- Likes
- 1
I've been looking at Pivot Points with support and resistance today. Anyone else use these as a guide they seem to have some value.
peterpr
Established member
- Messages
- 609
- Likes
- 7
This morning I went short at 4472 on 2 contracts, then bought 4 to go long on 2 at 4465 just as the opening gap was closing, then added to them a few points further down. I actually hit both top and botton of the opening half hour spot on. All looked OK until we hit 4072 again then, downhill all the way - Oh dear! - and I thought I was being sooo clever. I was certain we were going to see 4490-4450. Just how wrong can you be?
I watched both the IG and Cantor cash contracts like a hawk for most of the afternoon and something is puzzling me. It goes like this:
As we approached the closing bell, both contracts continued their irratic but inexorable decline to as low as 4423 before bouncing a couple of points to 4425 at the end (ie well below the provisional index close). During that time the US markets (DJIA & S&P500) had remained fairly steady and off their earlier lows at about 0.15% down. Within 1 minute of the UK close both the IG and Cantor cash contracts had shot up about 6-8 points whilst the US remained static.
Anyone care to offer some thoughts on the mechanics of this kind of thing in terms other than the value of futures because I'm near certain that the operators marking the IG and Cantor contract values up in those few seconds did so with reference to things other than exchange indexes.
For information, I had a couple of years manageing small Broker bonds (£3-5 million back in the mid-eighties - all telephone/paper based then) but am relatively new to trading stocks and indices on my own account - just 6 months to date. Done blindingly well until today when I seem to have caught a bit of a cold! Must have been getting a bit cocky I guess - Still, a bit of healthy failure is good for the soul they say, so I think I'll just book it to lessons paid for and learned!
Roll on Tuesday!!
Are you referring to the 4.30pm close or the futures close of 5.30pm.
After these times the prices can be erratic and spreadbetting companies give the impression that when they change over from an exchange price they place their price on the side they favour until things settle down IMHO.
As for the morning it followed another failed breakthrough so the 1st sell was when 4470 was hit and the 2nd when the lower pivot high was formed. There was a quick buy in between these positions but as soon as the lower pivot was formed the down side had the upper hand.
I use both 5 and 15 min charts so that I keep 5 days data available for such failures and the 5 min for the action of the day and this chart is the master because it relates to the current day.
I trade from trends of the 5 min chart.
Tomorrow is another day, remember to trade what you see and not what you think.
Kevin
peterpr
Established member
- Messages
- 609
- Likes
- 7
kevin546 said:Are you referring to the 4.30pm close or the futures close of 5.30pm.
The 4:30. But, on revisiting it and looking at the 1 minute chart, there really was some very hectic activity right on that close. In the last minute the index jumped from @ 4424 to 4430.7 with most of that apparently occuring in the last few seconds. Not that I have a problem with it, -it actually eased what remained of my open long position. So, to the extent that I cannot avoid having some emotion invested in these things, it actually lifted my spirits a bit. I'm just facinated by the mechanics.
I'm pretty clear about the value of the technicals, but I'm also interested in the human pressures/motives/imperatives etc that produce them. There must have been some pretty impressive buying volume booked in those last few seconds - by whom I wonder?
Peterpr
At the close and after hours trading can be likened to a lottery. Its when final books are closed you can make some good profits but at the same time you can take a hit as the price can leap about like a rubber ball. Its best to avoid it IMHO unless trading from a longer perspective but then you would not be monitoring every price move with such a strategy.
Kevin
Kevin
peterpr
Established member
- Messages
- 609
- Likes
- 7
peterpr said:.... There must have been some pretty impressive buying volume booked in those last few seconds - by whom I wonder?
Peterpr
Before someone jumps on that - since buying volume is obviously matched exactly by selling volume - perhaps I should rephrase it:
There must have been a pretty impressive volume of bids moved towards asks and settled in those last few seconds.
Peterpr
here's an extract on the auction.
"Closing Auction
After continuous trading finishes at 16.30 there is a five-minute closing auction period between 16.30 and 16.35 followed by a random 30-second end period. Between 16.35 and the uncrossing, orders can be deleted but not entered to avoid manipulation. Like the opening auction, there can be market order and price monitoring extensions.
Market order extension - Where there is an incomplete market order because there is insufficient liquidity on the other side of the order book to complete it. The auction process is extended by two minutes followed by a random 30-second end period.
Price monitoring extension – Where the uncrossing price is more than 3% away from the base price for FTSE 100 stocks or more than 5% away for other SETS stocks there will be a 5-minute extension and random 30-second end period. The base price is the volume weighted average price for the last ten minutes of normal trading (16:20 –16:30). If there is no VWAP, then the last order book trade (AT) is used as reference. If the uncrossing price is still outside these parameters, a second price monitoring extension period is initiated for a further 5 minutes and random 30 seconds.
The closing auction usually generates the official closing price except when there was no uncrossing in the auction or when the volume that crossed was so low as to not be representative. Usually this is half NMS or at least 2,500 shares for securities with an NMS below 5000.
Again extensions can only occur once but can happen in either order with the market order extension receiving priority"
Similar threads
- Replies
- 2
- Views
- 2K
- Replies
- 0
- Views
- 2K
- Replies
- 0
- Views
- 2K


